 Ethras
 Blog
Ethereum Stablecoin Fortnight: Tracked Dollar-Pegged Supply Fell 4.47%
Ethereum's tracked USD-pegged supply fell 4.47% across two weeks of daily snapshots. We separate the USDT and USDC contribution, changing concentration, and claims the data cannot support.
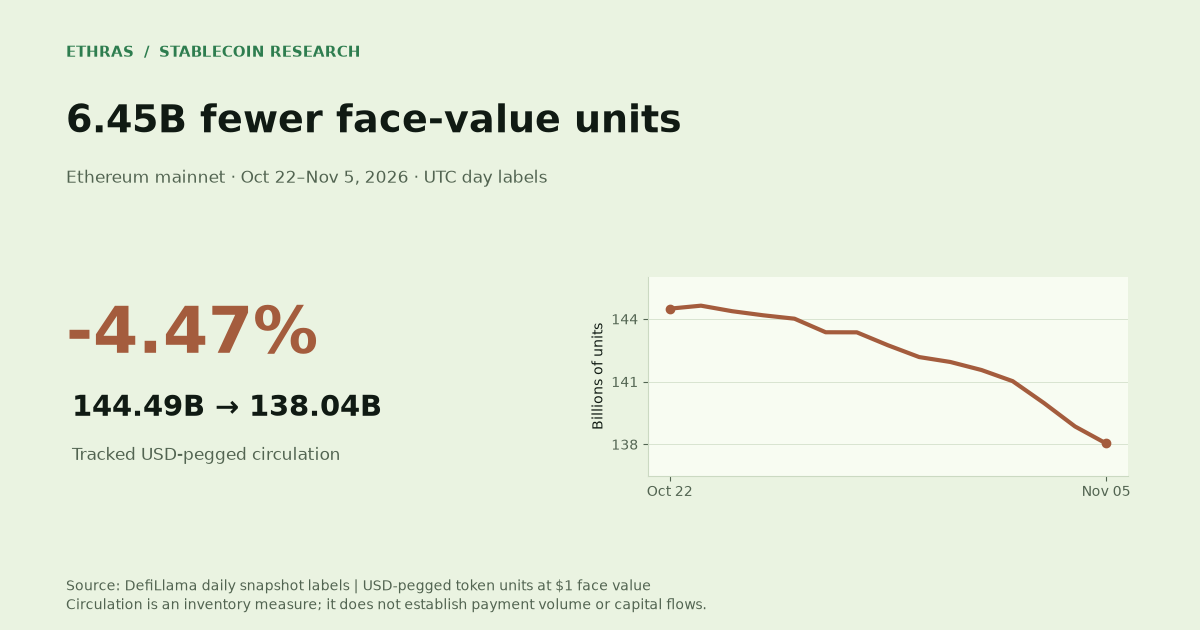
Ethereum's tracked dollar-pegged asset circulation contracted by 6.454 billion face-value units, or 4.47%, between DefiLlama's daily snapshots labelled October 22 and November 5, 2026. The previous fourteen-day interval had declined by 1.26%.
Three details matter more than the headline alone. USDT and USDC account for 90.6% of the net reduction. The later seven days account for 72.8% of Ethereum's two-week decline. Meanwhile, the global-minus-Ethereum series also contracts: Ethereum's falling share does not establish that another chain received the missing balances.
This is a report about circulating inventory attributed to Ethereum mainnet. It does not measure merchant payments, unique people, or a dollar-for-dollar withdrawal from the financial system.
The measurement: one field, three snapshot labels
Data retrieved and frozen: November 6, 2026 (UTC). The statistics below compare the historical snapshot labels, rather than the retrieval date.
All calculations use totalCirculating.peggedUSD from the DefiLlama Ethereum history and the corresponding global history. Each tracked USD-pegged token unit is displayed at $1 face value. That convention avoids mixing currency units; it does not establish market value or cash backing. Non-USD pegs are excluded, and Ethereum L2 balances are not added to mainnet.
The provider's universe is broader than payment stablecoins. It includes BUIDL, which Securitize identifies as tokenized private-fund shares, not a stablecoin. We retain the provider's scope for reconciliation and label that row explicitly.
The current interval is October 22 → November 5; the comparison is October 8 → October 22, fourteen days each. These are provider-labelled daily snapshots, not independently verified balances at exact midnight blocks. We exclude the November 6 bucket, which can still reflect current updates. The provider's calculation code also allows recent-value carry-forward, and history can be revised.
Ethereum contracted faster than the global series
| Series | Oct 22, bn units | Nov 5, bn units | Change, bn units | Change |
|---|---|---|---|---|
| Ethereum mainnet | 144.494 | 138.040 | -6.454 | -4.47% |
| Global tracked supply | 304.163 | 295.744 | -8.419 | -2.77% |
| Global minus Ethereum, derived | 159.669 | 157.703 | -1.966 | -1.23% |
Ethereum's share of this global universe falls from 47.51% to 46.68%, a decline of 0.83 percentage points. Its reduction represents 76.7% of the global net decrease, despite starting at less than half the global stock. This locates the contraction arithmetically; it does not identify its cause.
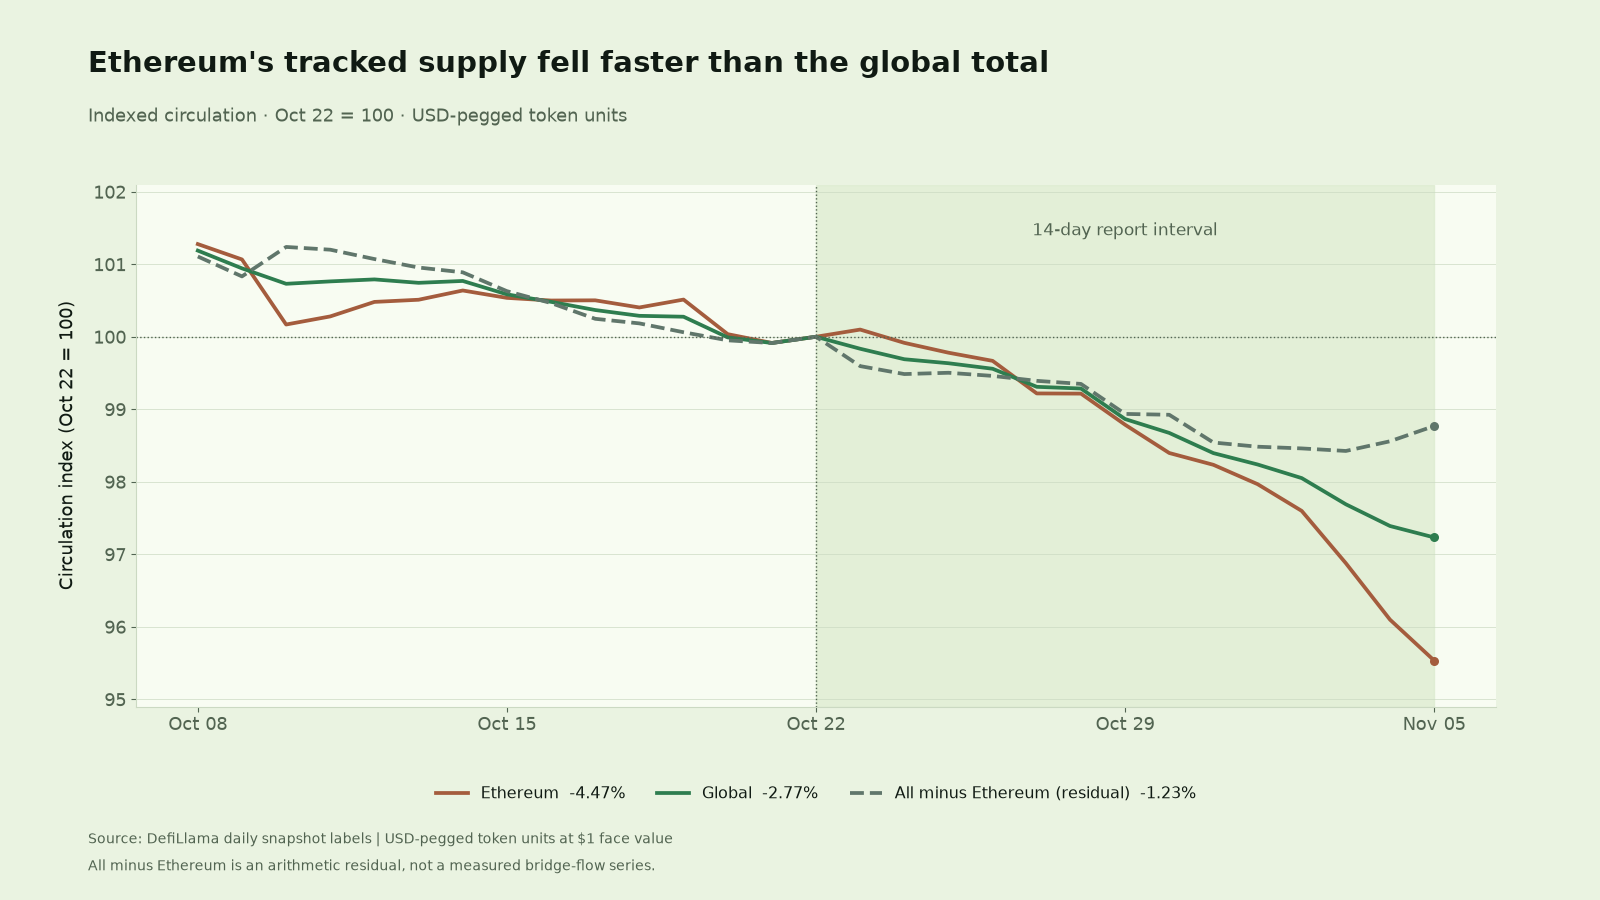
The residual is calculated by subtraction. At the aggregate level, this remainder also shrank; the comparison does not show a net increase outside Ethereum. Individual destination chains could still have grown while others contracted, requiring chain-level and transfer-level evidence to establish destinations.
USDT and USDC explain most of the net change
We use the same history endpoint with each asset's ID, rather than comparing live balances with historical totals.
| Asset | Oct 22, bn units | Nov 5, bn units | Change, million units | Two-week change |
|---|---|---|---|---|
| USDT | 72.557 | 68.155 | -4,401.6 | -6.07% |
| USDC | 44.826 | 43.384 | -1,442.8 | -3.22% |
| USDS | 6.711 | 6.492 | -219.0 | -3.26% |
| DAI | 4.172 | 4.148 | -24.3 | -0.58% |
| USDe | 2.459 | 2.508 | +48.3 | +1.96% |
| RLUSD | 1.449 | 1.726 | +277.8 | +19.18% |
| PYUSD | 1.865 | 1.747 | -118.0 | -6.32% |
| USDf | 1.613 | 1.565 | -48.1 | -2.98% |
| USD1 | 1.369 | 1.181 | -188.2 | -13.74% |
| USDG | 0.303 | 0.272 | -30.9 | -10.21% |
| BUIDL (tokenized fund) | 0.423 | 0.402 | -21.2 | -5.00% |
Selected asset changes total -6,168.0 million units. All remaining tracked USD-pegged assets contribute a net -285.5 million; together they reconcile to the unrounded Ethereum total. The provider's universe contains different instrument designs, so these rows should not be read as economically interchangeable cash reserves.
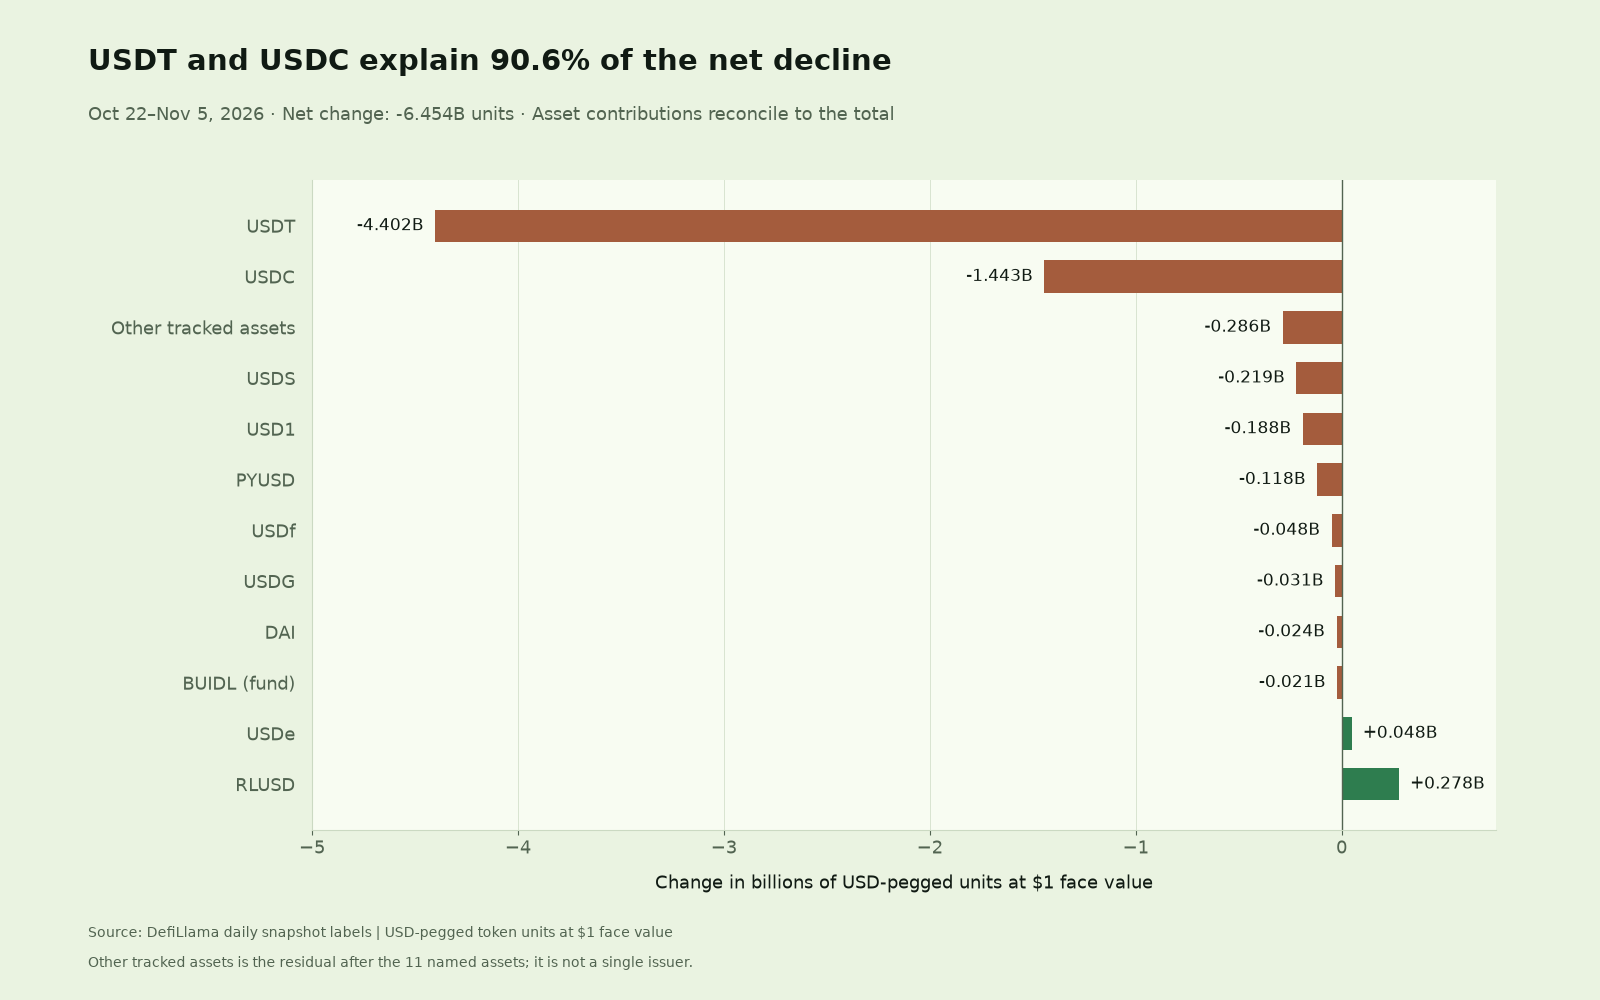
USDT's reduction is roughly three times USDC's. Together they lose 5.844 billion units. That is 90.6% of the net contraction, not 90.6% of gross redemptions: positive and negative changes elsewhere offset one another.
RLUSD's 19.18% expansion is substantial relative to its starting balance. Its 277.8 million-unit increase is 4.3% as large as the net Ethereum decline. Percentage growth and contribution answer different questions. USDe's smaller increase also shows why a falling aggregate should not be described as a uniform retreat across every asset.
The pace changed more than the leading pair's share
Ethereum loses 1.753 billion units between October 22 and October 29, followed by 4.700 billion between October 29 and November 5. These are equal-length intervals, making the later reduction about 2.68 times the earlier one. The fortnight headline conceals that acceleration.
The asset breakdown makes the acceleration more specific. USDT's weekly reduction expands from 0.904 billion to 3.498 billion units, while USDC's eases from 0.781 billion to 0.662 billion. USDT alone accounts for 74.4% of Ethereum's later-week net reduction. The next investigation should therefore examine the events behind the USDT change, rather than assume both leading assets accelerated together.
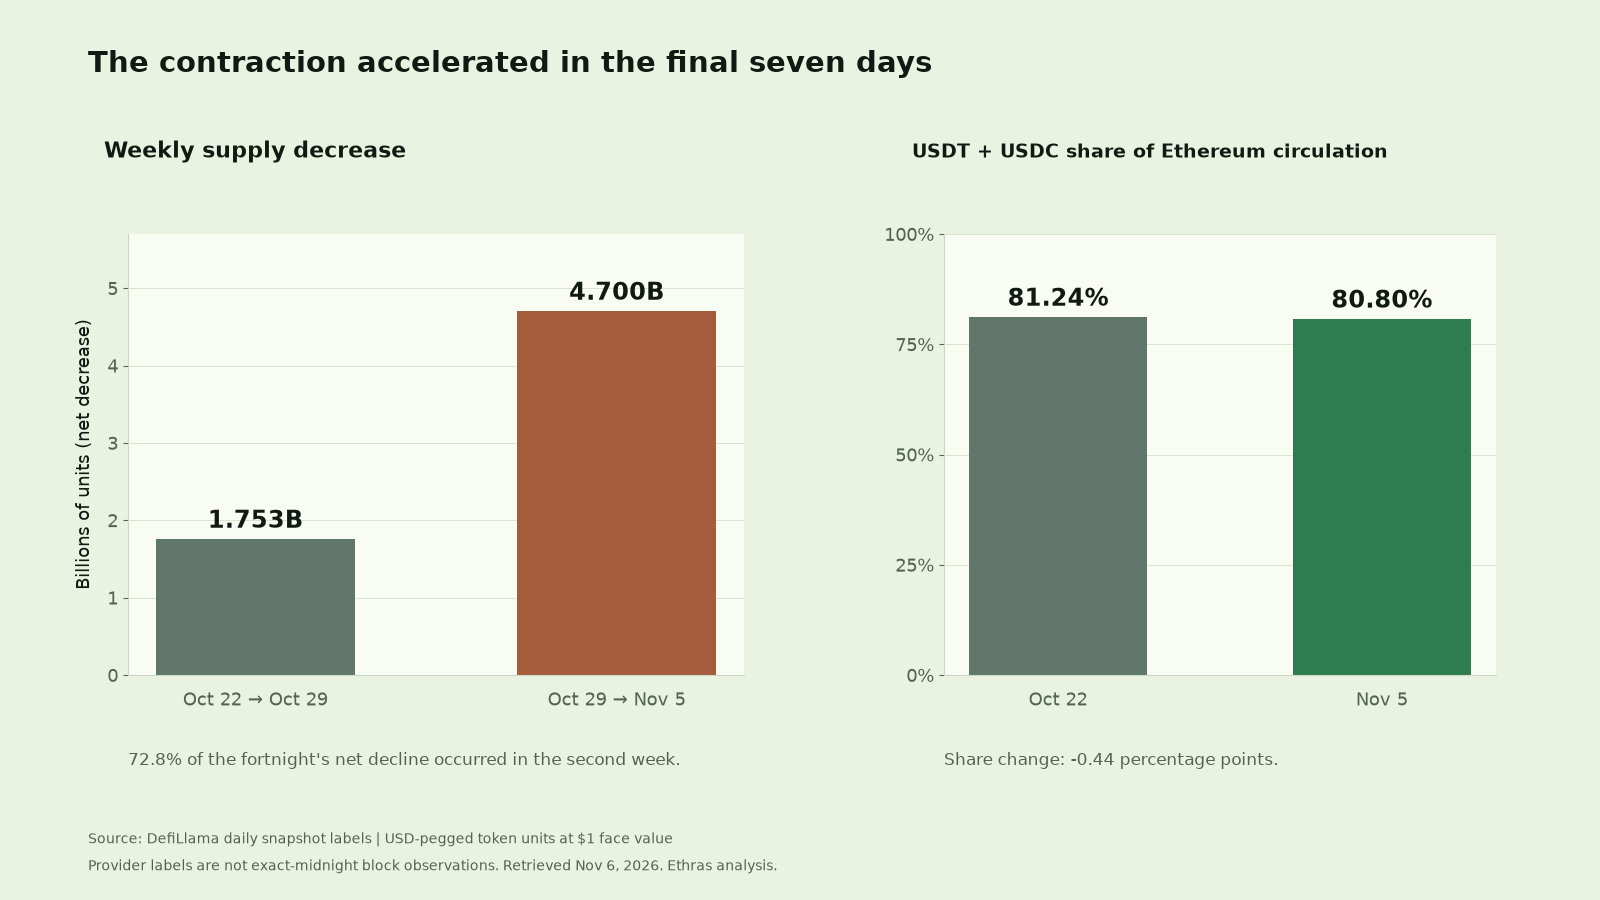
USDT and USDC's combined share of all tracked Ethereum circulation falls from 81.24% to 80.80%, or 0.44 percentage points. Using that same Ethereum-wide denominator for each asset, USDT's share falls from 50.21% to 49.37%, while USDC's rises from 31.02% to 31.43% despite its falling balance. Ethereum's total contracted faster than USDC's balance, so USDC gained share while its units decreased.
This is a two-asset concentration measure. We do not treat the heterogeneous “other assets” bucket as one issuer or calculate an issuer concentration index from it.
Inventory, capital flows, and payments need different evidence
Inventory: the observed quantity here is provider-attributed circulating supply. DefiLlama's attribution logic adjusts for unreleased balances and cross-chain attribution. It is not simply an ERC-20 contract's totalSupply().
Capital flows: a chain-local supply change does not identify whether a holder redeemed with an issuer, changed chains, or whether attribution changed. For example, Circle's native USDC interoperability uses burn-and-mint: a source-chain reduction can accompany destination issuance. That mechanism is a reason to investigate matched events, not proof that it explains this period's figures. A claim about new external dollars would additionally need issuance and redemption evidence.
Payments: transfer activity is a separate dataset. One stock can move repeatedly; a single transaction can emit several token transfers. Transfers can represent exchange operations, routing, collateral movements, or payments. The Visa/Allium dashboard distinguishes raw and adjusted activity, and its September methodology refresh illustrates how expanded labels can change a historical adjusted series. We did not obtain an identically filtered Ethereum fourteen-day transfer dataset for this report, so we do not invent a payment, transfer-volume, or user-growth result.
Three follow-up reports that could test the explanations
- What explains USDT's later-week reduction? Reconcile issuer issuance and redemption records, treasury balances, and chain-swap evidence. USDC can be a separate cross-chain case study using paired native burn-and-mint messages; its different weekly pattern should remain visible.
- Did settlement activity move with supply? Compare USDT and USDC transfer value, transaction counts, and size distributions under one versioned filter. Show raw and filtered results side by side, while keeping “transfer” distinct from “payment.”
- Who held the changing inventory? Compare balances for labelled exchanges, DEX pools, and treasury contracts at consistent snapshots. Publish label coverage and keep address counts distinct from people.
The current evidence supports a narrower, useful conclusion: Ethereum-attributed USD-pegged inventory contracted faster, with the net reduction dominated by USDT and USDC and concentrated in the later week. Identifying the destinations, economic uses, and reasons requires the next layer of data.
Share this article
Share on XReview your account and post on X. Opening X or copying text does not send a post.